Simpson’s Paradox and segmentation: why analysis is crucial
What is Simpson’s Paradox?
Simpson’s Paradox refers to a data phenomenon where a trend existing in groups reverses when the data is studied as a whole. When it comes to analytics, understanding this paradox is vital since it can completely alter any insights gained from the data itself.
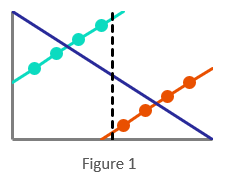
Figure 1. demonstrates two series’ of data (light blue and orange), each showing clear patterns. However, when the data is grouped together, the best fit pattern reverses (dark blue); a person on the black dotted line could have any of the three intersecting values. This has a huge impact on forecasting and reporting. Having no visibility of series is the same as not segmenting the data.
Simpson’s Paradox and segmentation: gender bias at UC Berkeley
An example of Simpson’s Paradox is an investigation into gender bias among students applying to the University of California. Male applicants were 44% successful compared to 35% of female applications. Surely such an obvious difference in success rates is evidence of favouritism on the part of the university?
Well, maybe. Dig a little deeper, however, and another possibility is revealed.
The table below holds the data for the largest 6 departments at UC Berkeley:

Here, the data shows that at department level, there’s actually very little evidence of bias towards men.
In fact, the largest ‘departmental bias’ occurs is in department A, where the female admission rate is 20% higher than the male. Further analysis of the variables indicates that men have better overall success rate because they apply to more lenient departments. As the table indicates, departments A and B have much higher admission rates than the other 4. These attract just 7% of female applications (from the top 6 departments), compared to 51% of male ones.
Another well-known example of Simpson’s Paradox is in the comparison of baseball batting averages, whereby a player can have a higher batting average than another across many seasons, but a lower one in each individual season.
Simpson’s Paradox and segmentation in business
I know what you’re thinking. How does the relationship between Simpson’s Paradox and segmentation apply in business situations?
Recently, I did some reporting for an arts venue which focused on how their sales have grown and what has driven that change.
Fig. 2 shows that the rise in sales was due to an increase in ticket prices.
Larger group size and frequency growth offset a decline in customer numbers (We'll come back to that frequency growth shortly). So far, the obvious way to improve this sales growth would be to reverse that customer decline.
I then segmented data so the venue could use bespoke targeting on different customer types. They would receive tailored communications to improve each segment's sales growth. This, in turn, would improve the total sales growth. Customers were split into New, Lapsed and Active. Active customers were grouped into past frequency bands 1 to 3 (increasing in order). The sales growth chart at segment level looked very different:

Fig. 3 shows that frequency growth had declined for every customer segment. In Fig. 2 we saw that frequency growth had grown for the whole. This is due to the increase in the proportion of customers who were Active and in higher frequency bands. These groups naturally have higher frequencies.

Conclusion
Segmenting the data groups for the arts venue showed an occurrence of Simpson's Paradox. The total view suggested that frequency growth wasn't a concern for the venue; in fact, each segment had declining frequency. Moving forward, the venue should act to counteract this trend.
Without segmenting the data to reveal underlying patterns, this information would have been invisible. The venue would only have found out about the low-level frequency decline much later, at a point when the trend would have been much harder to reverse.
References
1. https://homepage.stat.uiowa.edu/~mbognar/1030/Bickel-Berkeley.pdf
2. https://en.wikipedia.org/wiki/Simpson%27s_paradox
3. Ken Ross. "A Mathematician at the Ballpark: Odds and Probabilities for Baseball Fans (Paperback)" Pi Press, 2004. ISBN 0-13-147990-3. 12–13
Interested in our capabilities and want to find out more?

CRM is the world’s largest software market, and grew even more under lockdown
In 2017, customer relationship management software revenue reached £31 billion and became the world’s largest software market. In this blog we discuss the advantages of effective CRM tools including increased sales, sales productivity, sales conversion rates as well as improved levels of customer retention and satisfaction. Find out how your business can leverage the power of CRM software.
Read More
Use the Lockdown Lull to Spring Clean your Data
The lockdown has inspired a spring-cleaning trend, so now your house is in order, how about refreshing your data to ensure you get the most out of it? Are your customers feeling valued or could they do with some TLC too? Here are some tips to help you get started.
Read More
Automating RFM segmentation and labour-intensive tasks
With the advancement of machine learning and artificial intelligence, automation is becoming more and more prevalent within the business world. However, there is still a big gap in our understanding of just how much can be automated. What is RFM and does your business need it?
Read More
CRM Strategy: How to build and maintain customer relationships
Today, building a meaningful client base is more important than ever. When it comes to costs, acquiring new customers is five times more expensive than keeping existing ones. So how do you actually maintain lasting customer relationships? We’ve compiled some useful tips to help you grow and retain your hard-earned customers.
Read More
Goldilocks and the three steps to understanding machine learning
It’s a hot topic lately, but for many, machine learning is still a bit of a puzzle. This post looks at the key components, debugging and demystifying what is often seen as an overly technical concept, as well as offering some practical insights into how it all actually works.
Read More